


NZD/JPY Price Analysis: Buyers defend 20-day SMA despite consolidation
- Kiwi sees further consolidation against the Yen, maintaining support at the 20-day SMA after reaching the highest level since June 2007 on Thursday.
- Daily chart indicators are trending downwards, suggesting potential additional consolidation in the next sessions.
- Attempts to retest the 97.00 level are projected, but a break above this resistance seems improbable.
Friday records an extended consolidation phase for the NZD/JPY pair, maintaining its level after reaching the multi-year highs logged earlier the week. The technical landscape evidences the continuation of the consolidation phase, possibly constricting the pair's upside movements under the psychological resistance level of 97.00.
The daily Relative Strength Index (RSI) for NZD/JPY stands at 57, retracing slightly downwards and hinting at a decrease in the bullish momentum. The Moving Average Convergence Divergence (MACD) persists in printing flat red bars, reinforcing the notion of ongoing consolidation.
NZD/JPY daily chart
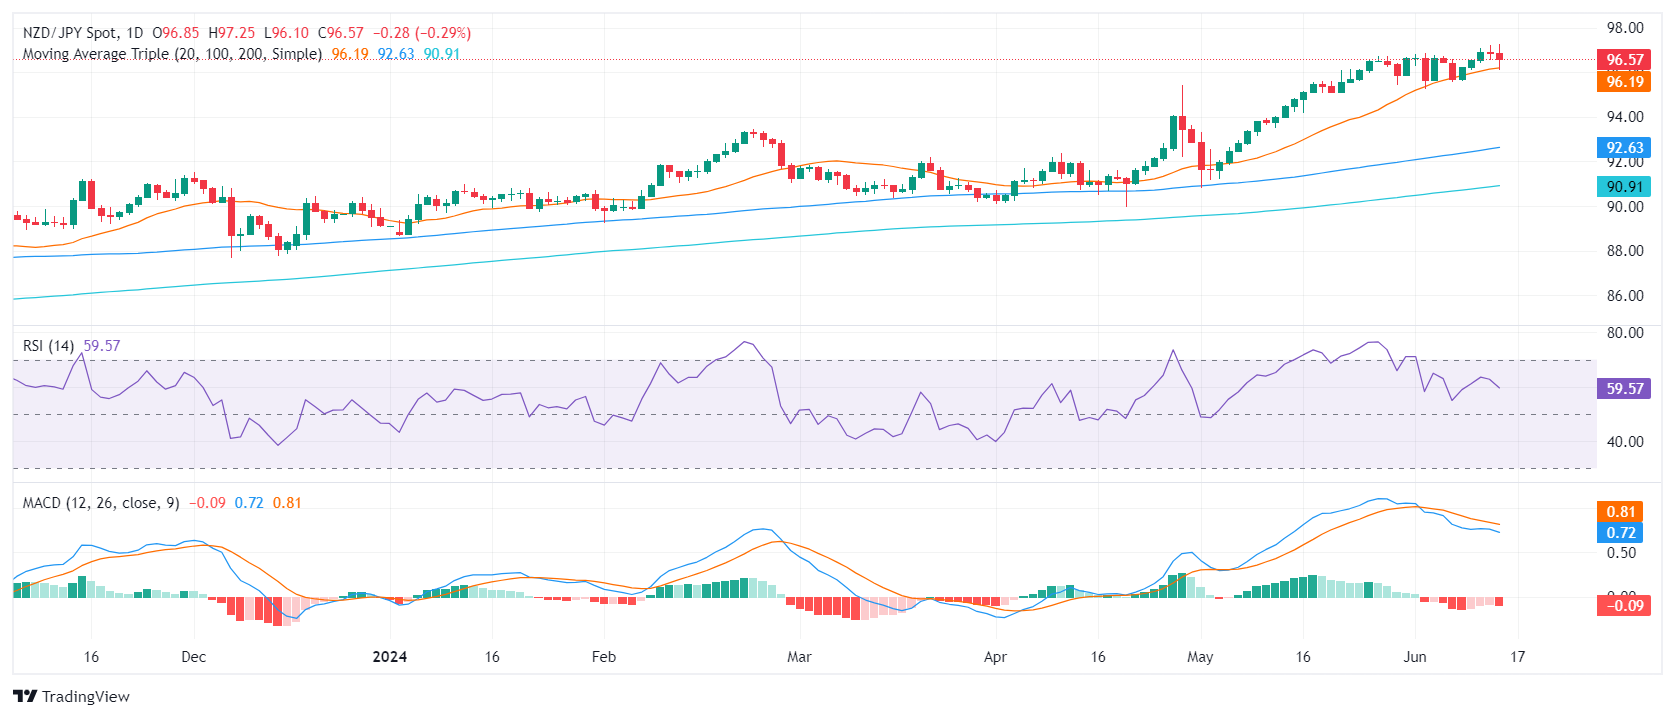
The uninterrupted presence of buyers above the 20-day Simple Moving Average (SMA) implies a concerted effort to uphold the bullish trend. That said, the exhaustion signal observed in the daily technical indicators underscores the market's need for additional consolidation after the significant bounce to 96.00 since May. The forthcoming trading sessions may see the pair oscillate between the support level of 95.00 and the resistance level of 97.00 as the pair ranks among the highest since June 2007.
The longer-term 100-day and 200-day SMAs established around 90.00 - 92.00 continue to safeguard the overall bullish outlook of the pair. Moreover, the 95.30 area also provides notable support against potential losses.