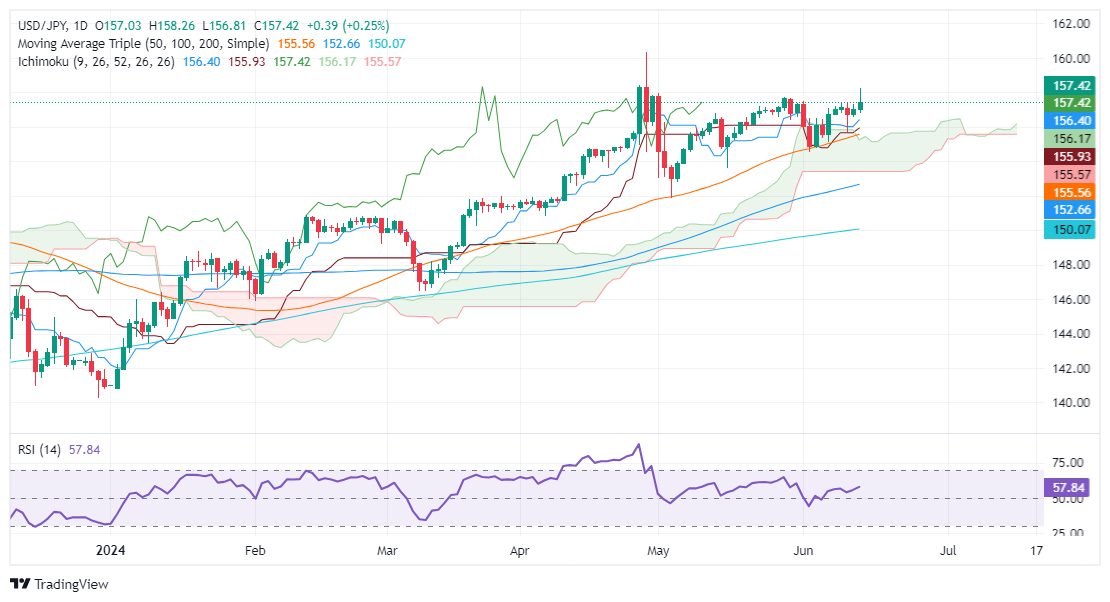
USD/JPY Price Analysis: Climbs steadily above 157.00
- USD/JPY trades at 157.36, up 0.22%, as BoJ keeps rates unchanged, weakening the JPY.
- Technical outlook: RSI indicates bullish momentum, with key resistance levels at 158.25 and 158.44.
- Support levels include the Tenkan-Sen at 156.00, June 12 low at 155.72, and Ichimoku Cloud low at 153.35/40.
The USD/JPY finishes the week on a higher note, registering gains of 0.22% on Friday after the Bank of Japan (BoJ) decided to hold rates unchanged, weakening the Japanese Yen (JPY). The Greenback strengthened due to risk aversion and the Wednesday Fed's hawkish hold. The pair trades at 157.36 at the time of writing.
USD/JPY Price Analysis: Technical outlook
From a technical standpoint, the USD/JPY climbs steadily, with buyers remaining in charge, as depicted by the Relative Strength Index (RSI). Momentum shows that bulls are losing steam, yet the RSI remains bullish.
The USD/JPY climbed past 157.00, and despite breaching 158.00, buyers failed to hold to its gains above the latter, which could have opened the door for further gains. If they would like to extend their profits, they must clear June’s 14 high of 158.25 before challenging the April 26 high of 158.44, ahead of 159.00. A breach of that level would clear the path to test the year-to-date (YTD) high of 160.32.
Conversely, if USD/JPY slides beneath the Tenkan-Sen at 156.00, the next stop would be June 12 low of 155.72. A breach of the latter and the pair could tumble toward the 154.00 figure, before testing the Ichimoku Cloud (Kumo) low of 153.35/40.
USD/JPY Price Action – Daily Chart


