AUD/JPY Price Analysis: Bulls remain weak and give up daily gains
- The AUD/JPY gave up daily gains and struggled to make a decisive upward movement.
- The hourly chart signals a shift to short-term bearish traction, with a downturn of the RSI.
- To ensure continued bullish momentum, buyers must defend the main SMAs.
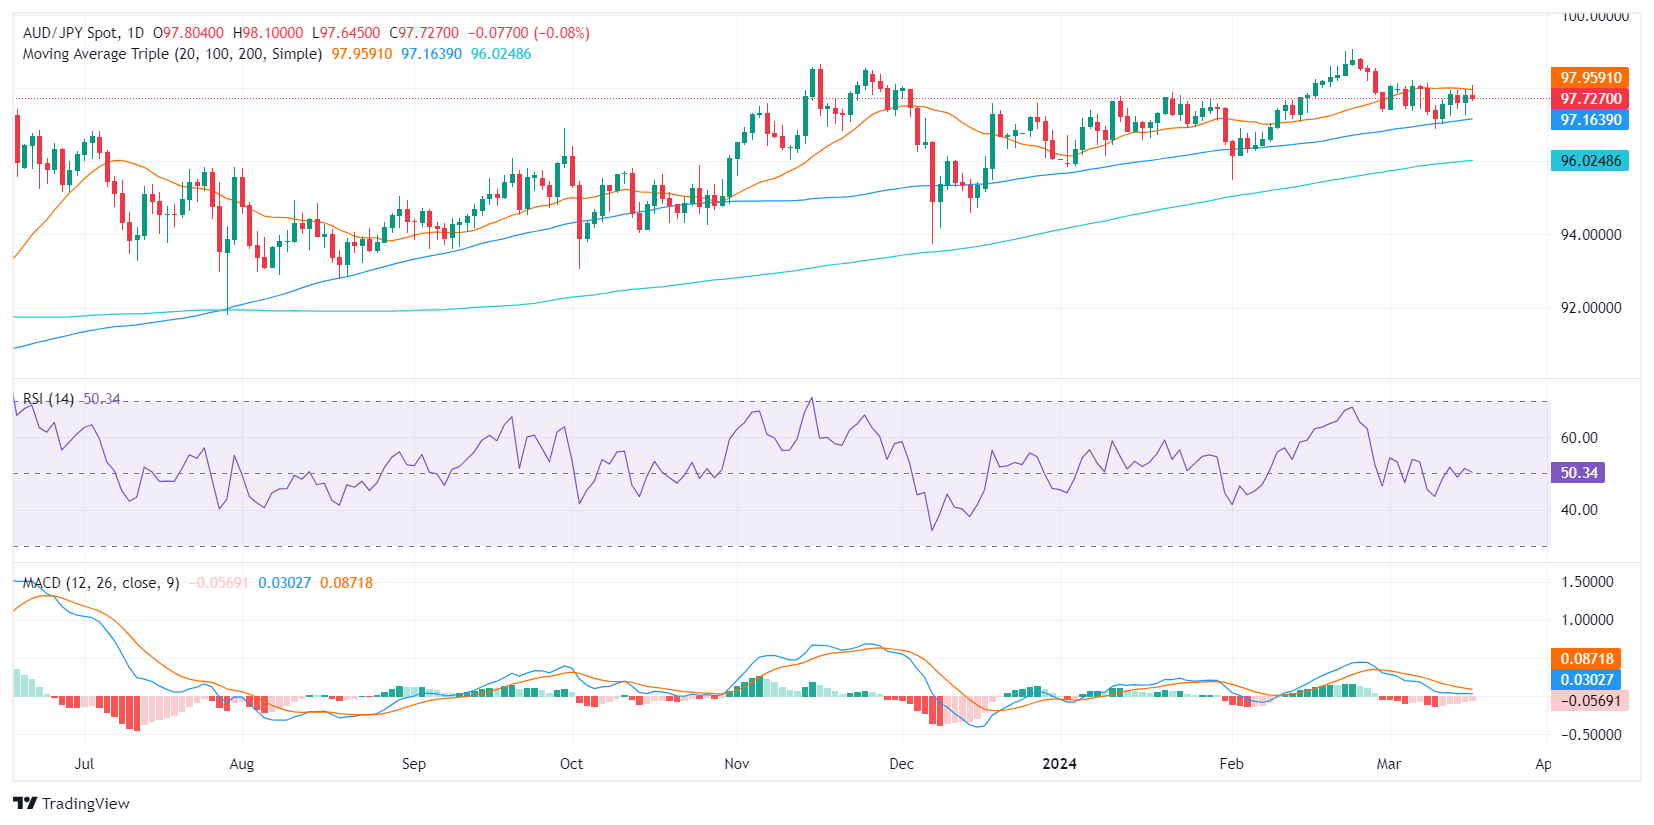
On Monday's session, the AUD/JPY pair is trading at 97.71, mildly down after peaking at a high of around 98.10, near the 20-day Simple Moving Average (SMA). Unless the buyers conquer this level, any upward attempt will be limited and the short-term outlook will be tilted in favor of the buyers.
Based on the indicators of the daily chart, the Relative Strength Index (RSI) has remained within the positive territory over the last several sessions, thus revealing a steady positive momentum. The Moving Average Convergence Divergence (MACD), however, reveals a less optimistic picture by displaying decreasing red bars, indicating a steady negative momentum and giving arguments for a neutral to bearish outlook.
AUD/JPY daily chart

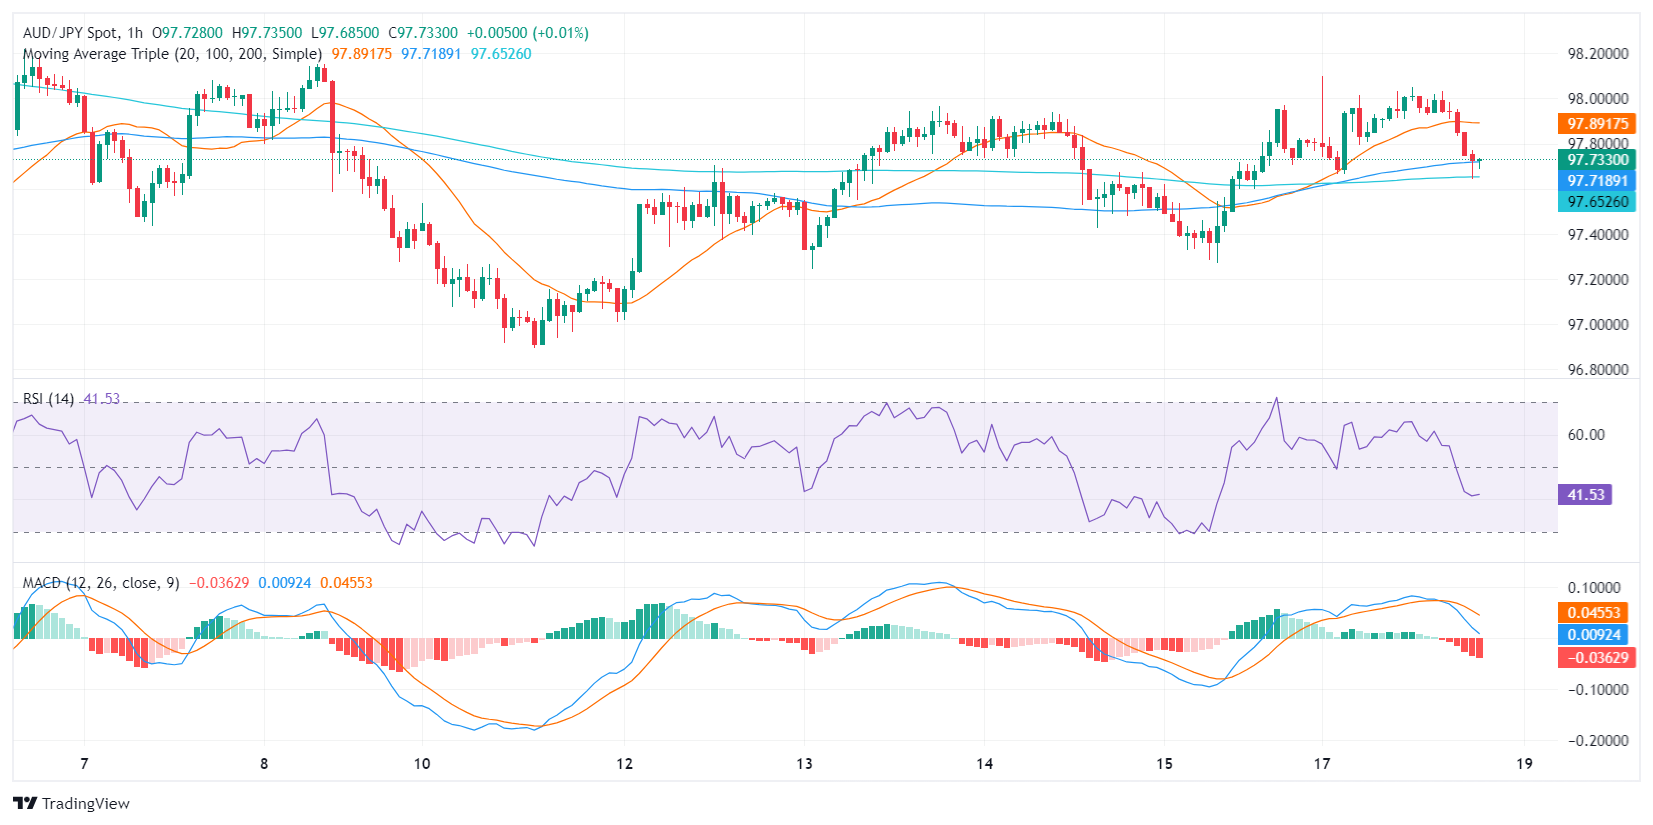
On the hourly chart, the RSI started the day around the 61 level representing a strong momentum, gradually losing strength as the session progressed to fall into the negative territory around 42 by the American session. The Moving Average Convergence Divergence (MACD) histogram, on the other hand, is increasing but remains in the negative territory, as represented by the rising red bars. Sellers seem to currently hold the reins in the hourly perspective.
AUD/JPY hourly chart

All in all, ahead of the Asian session, the sellers may continue gaining ground, and unless the buyers get a fundamental boost, they will have a hard time conquering the 20-day SMA to confirm a recovery. However, the primary task is to defend the 100 and 200-day SMAs to defen the long-term bullish outlook.


