NZD/USD Price Analysis: Trades near nine-day low around 0.5900 ahead of Fed’s policy
- NZD/USD recovers intraday losses but uncertainty remains with eyes on Fed’s policy announcement.
- The Fed may emphasize maintaining interest rates higher for a longer period.
- NZ Q1 wage growth rose expectedly while labor demand weakens.
The NZD/USD pair trades close to a nine-day low slightly below the round-level resistance of 0.5900 in Wednesday’s European session. The Kiwi asset recovers early losses in the aftermath of New Zealand Q1 Employment data.
The NZ labor market data showed that quarterly and annual Labor Cost Index grew in line with the consensus of 0.8% and 3.8%, respectively. This will deepen fears of NZ interest rates remaining higher for a longer period as high wage growth fuels inflationary pressures.
The labor demand was weaker than expected as Employment Change fell by 0.2% while investors forecasted the labor market to grow by 0.3%. The Unemployment Rate rose to 4.3% from the estimates of 4.2% and the prior reading of 4.0%.
Going forward, the Kiwi asset will dance to the tunes of the Federal Reserve’s (Fed) interest rate decision, which will be announced at 18:00 GMT. The Fed is expected to hold interest rates steady in the range of 5.25%-5.50% with a hawkish guidance as inflation has remained higher-than-expected in the first quarter this year. This has strengthened the US Dollar’s appeal. The US Dollar Index (DXY), which tracks the Greenback’s value against six major currencies, rose to 106.35.
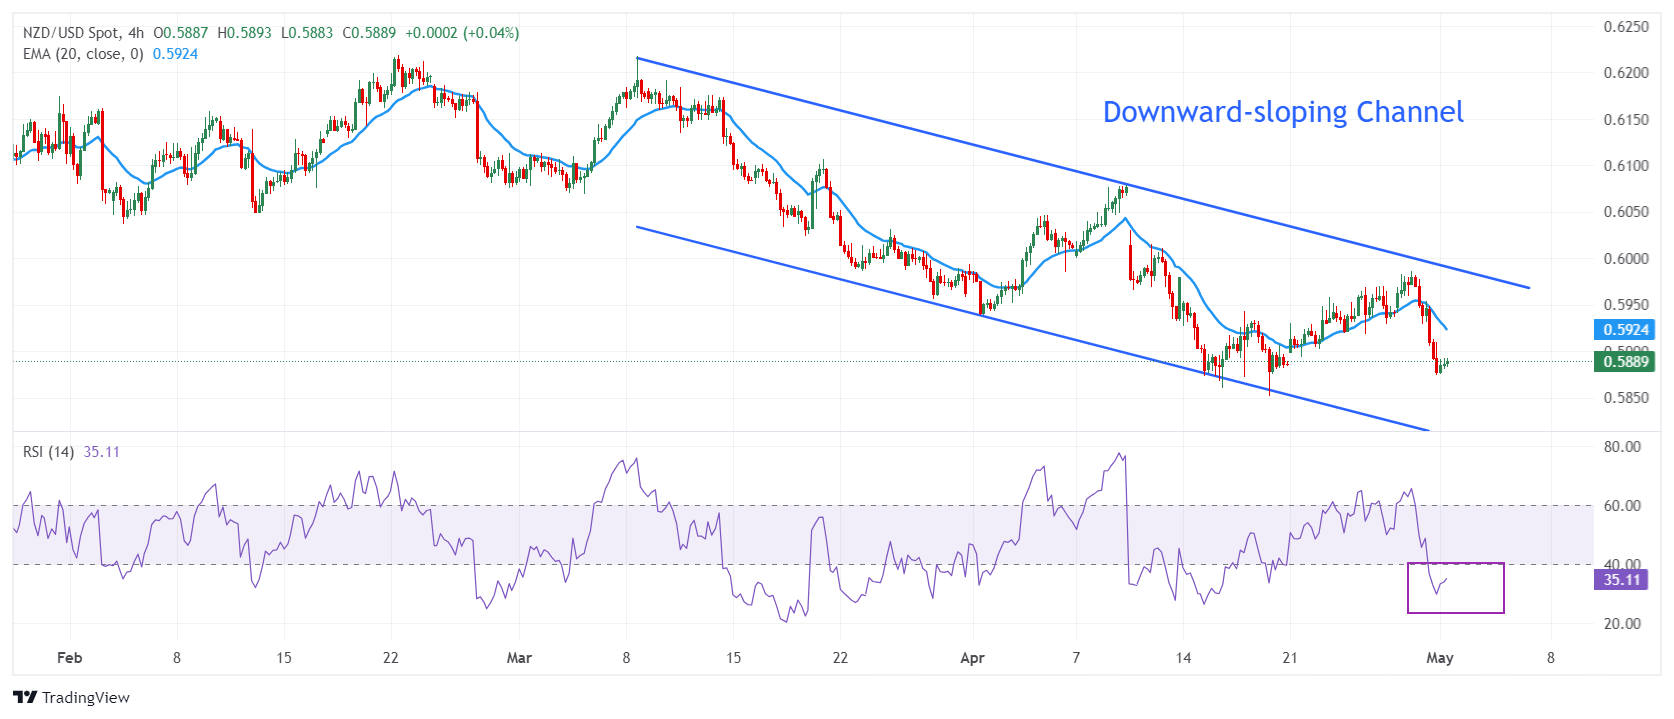
NZD/USD trades in a downward-sloping channel on a four-hour timeframe. This a bearish pattern in which each pullback move is considered as a selling opportunity by the market participants. The near-term appeal is bearish as the asset is trading below the 20-period Exponential Moving Average (EMA), which trades around 0.5924.
The 14-period Relative Strength Index (RSI) oscillates in the bearish range of 20.00-40.00, suggesting that momentum has leaned towards bears.
Fresh downside would appear if the asset breaks below April 16 low at 0.5860. This would drag the asset toward 8 September 2023 low at 0.5847, followed by the round-level support of 0.5900.
On the contrary, an upside above the psychological resistance of 0.6000 will drive the asset towards April 4 high around 0.6050 and the round-level resistance of 0.6100.
NZD/USD four-hour chart


