NZD/USD Price Analysis: Bearish overtones persist, bullish hints emerge on the horizon
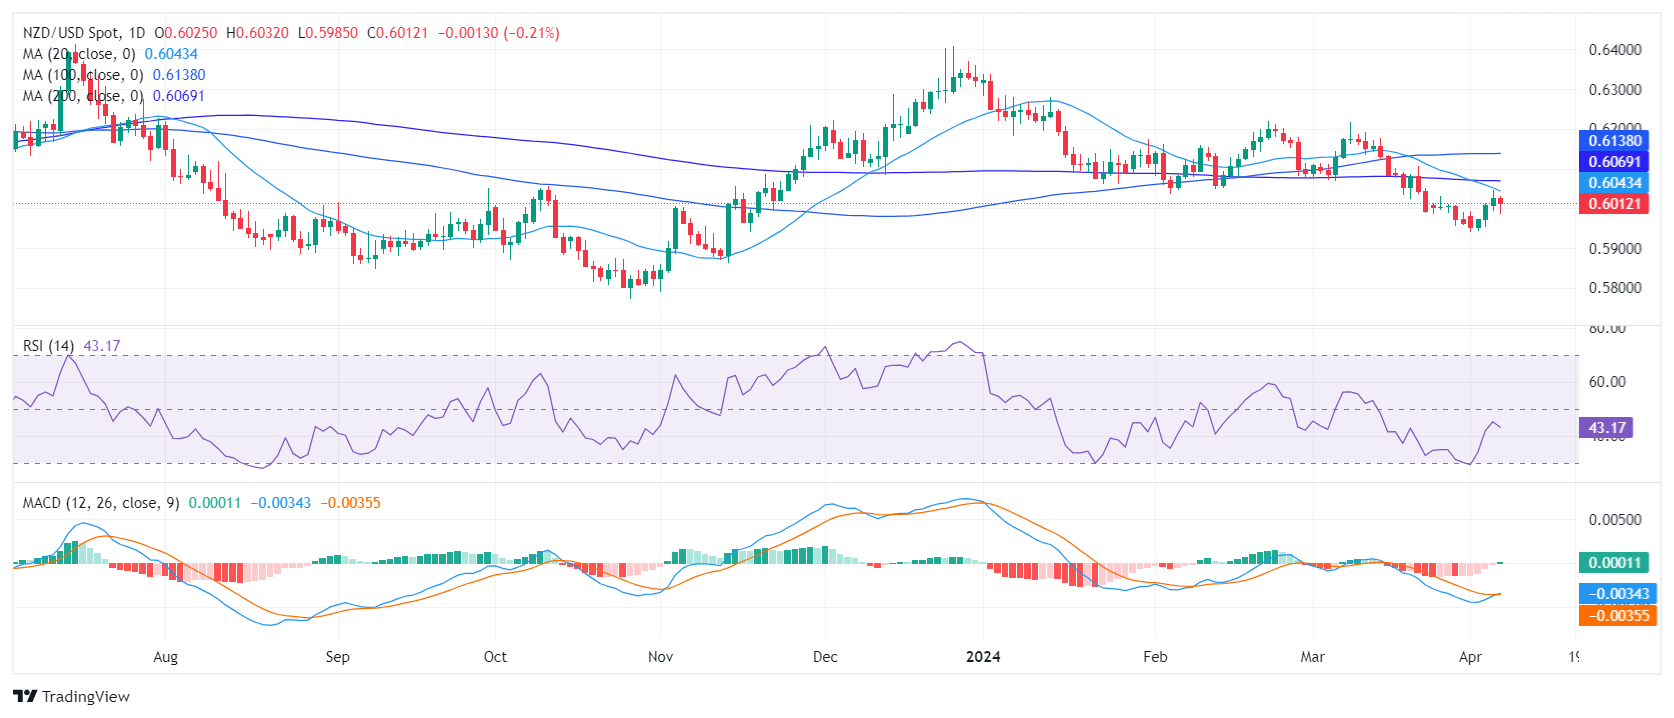
- The daily MACD shows a slight positive momentum, despite the overall bearish bias.
- The daily RSI indicates that the sellers are dominating, though the indicator's flat trajectory suggests that the bearish momentum may be slowing.
- On the hourly chart, the RSI oscillated near the neutral zone, showing inconsistent bearish-bullish signals.
The NZD/USD pair is trading at 0.6013, indicating a drop of 0.26% in Friday's session but will close a winning week. The prolonged downward trend suggests that sellers command the current market. However, the short-term outlook reveals a slight bullish momentum, which could lead to a period of sideways trading in the next sessions.
The daily Relative Strength Index (RSI) resides in negative territory, with a slightly flat slope, indicating sellers dominate this market but seem to be taking a breather. Moreover, the Moving Average Convergence Divergence (MACD) histogram has registered a green bar, pointing to a slight emergence of positive momentum.
NZD/USD daily chart

On the hourly chart, the most recent RSI reading of 47 hovers close to the neutral zone while the MACD histogram draws flat green bars, which can be interpreted as somewhat positive short-term momentum.
NZD/USD hourly chart

Regarding the overall trend, the NZD/USD remains under the 20,100 and 200-day SMA indicating that the overall trend favors the bears. So in case the buyers manage to gain ground, any movement below these levels wouldn’t be considered a serious buying signal.


