EUR/USD Price Analysis: Keeps steady above 1.0700 amid shift to upward momentum
- EUR/USD holds its position above the psychological level of 1.0700 amid a momentum shift toward an upward trend.
- The immediate barrier appears around the major level of 1.0750, aligned with the upper boundary of the descending channel.
- A break below 1.0700 could lead the pair toward the support level of 1.0650 and April’s low of 1.0601.
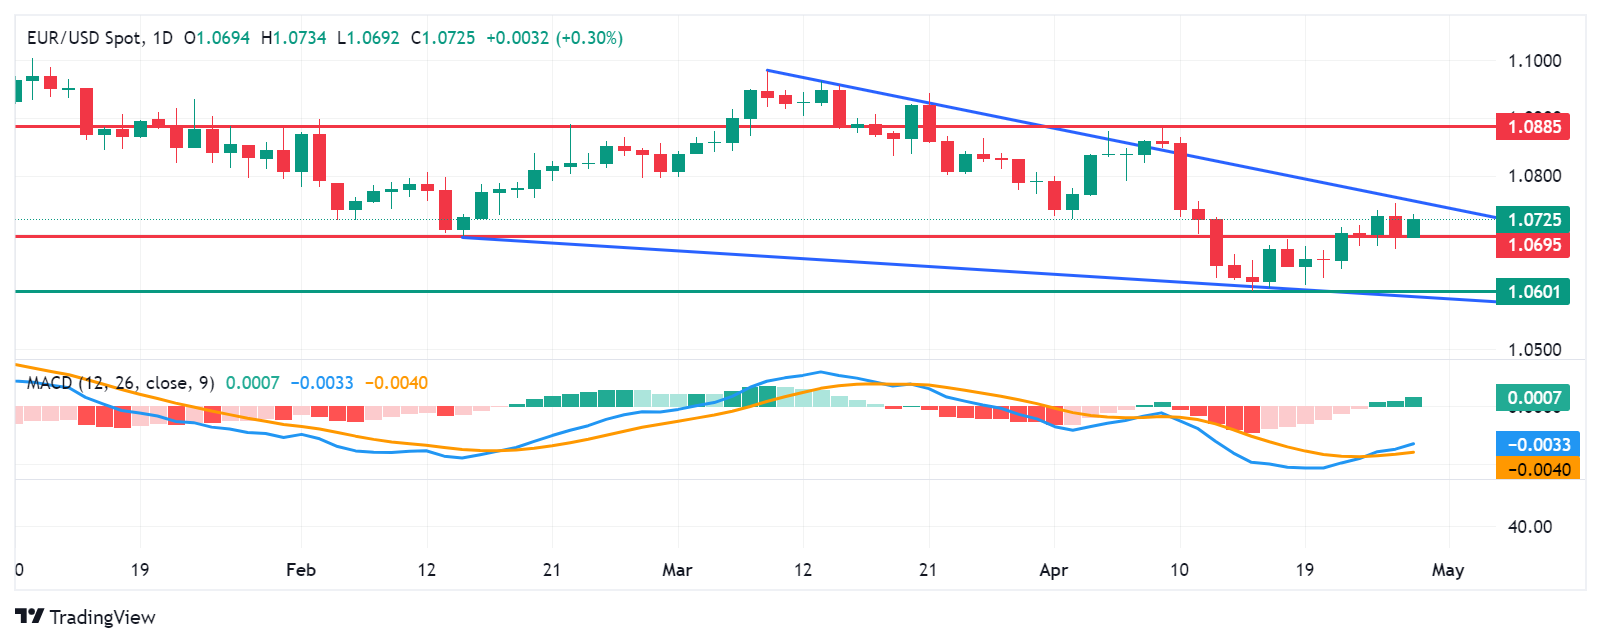
EUR/USD recovers its recent losses registered in the previous session, trading around 1.0720 during the Asian session on Monday. From a technical perspective, analysis indicates a weakening bearish sentiment for the pair as it continues to advance within the descending channel, breaching the key psychological level of 1.0700.
Furthermore, the lagging indicator Moving Average Convergence Divergence (MACD) suggests a shift toward upward momentum for the EUR/USD pair. Although positioned below the centerline, it exhibits divergence above the signal line.
The EUR/USD pair faces an immediate barrier at the major level of 1.0750, corresponding with the upper boundary of the descending channel. A successful breakthrough above this level could provide upward momentum for the pair, targeting the area near the psychological milestone of 1.0800, followed by April’s high at 1.0885.
On the downside, key support for the EUR/USD pair is anticipated around the psychological threshold of 1.0700, coinciding with major support at 1.0695. A breach below this level could exert downward pressure on the pair, potentially driving it toward the vicinity of the major support level at 1.0650. Further support levels may emerge around April’s low at 1.0601, aligning with the lower boundary of the descending channel.
EUR/USD: Daily Chart


