


NZD/USD Price Analysis: Bulls seeking a higher correction on weekly chart
- RBNZ day and the technicals offer prospects of a bullish continuation on the weekly chart.
- The lower time frames are leaning meanwhile bearish for a restest of current daily support prior to bullish continuation.
As per the prior analysis, NZD/USD Price Analysis: Bears break the neckline of H1 head and shoulders, 0.6420 eyed, the bears broke out of the H&S and moved in on the 0.6420s. The price has since reverted back to the upside to test daily resistance again ahead of the Reserve Bank of New Zealand.
The following analysis illustrates the recent price trajectory and how the schematics have played out across a number of time frames for a clear picture of the market's structures heading into the meeting. There is something for both the bulls and bears across the multi-time frame analysis.
NZD/USD H1 chart, prior analysis

NZD/USD H1 chart, live market

NZD/USD weekly chart
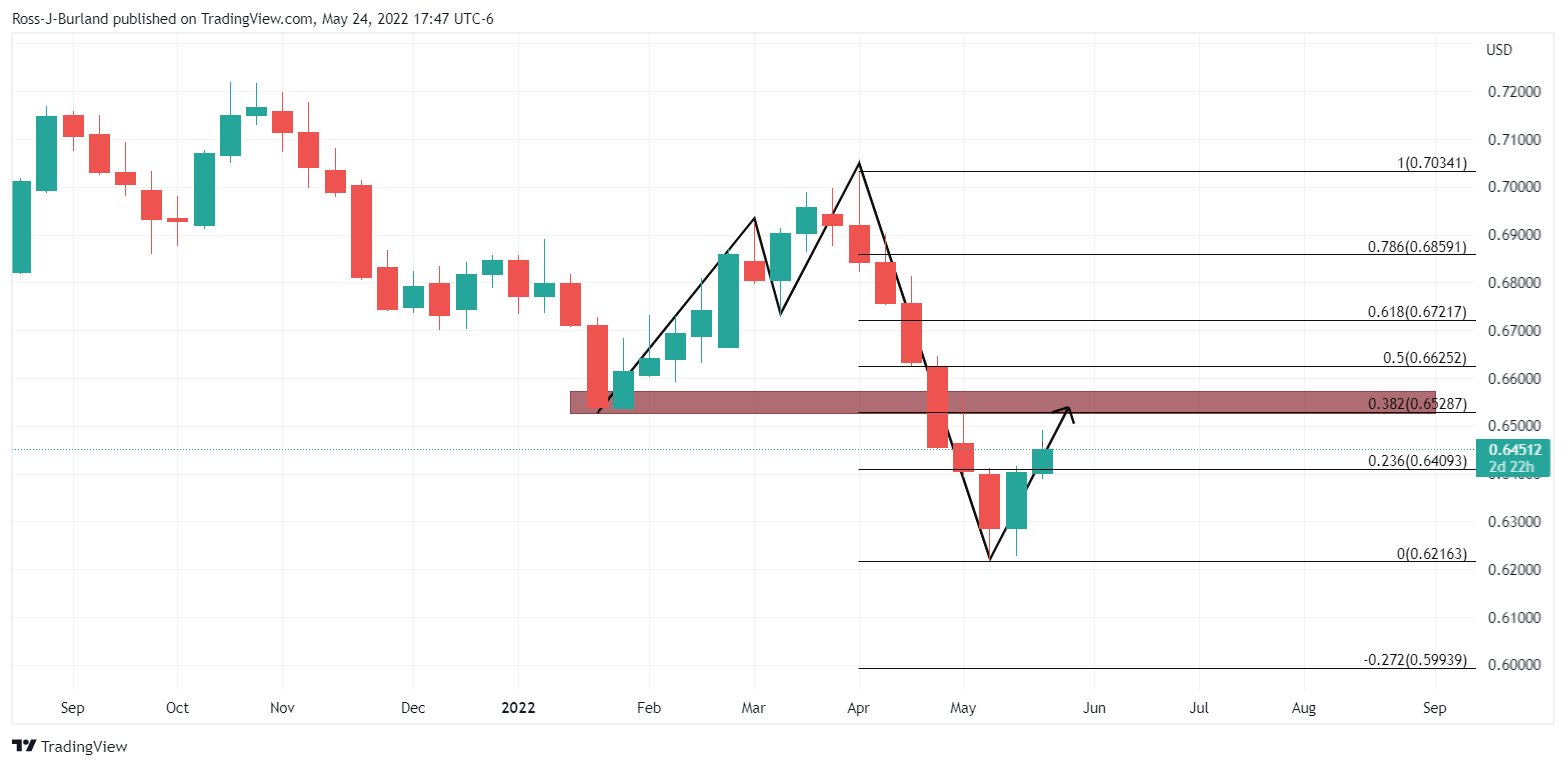
From a weekly perspective, there is room for a higher correction into the prior weekly swing lows that have a confluence with the 38.2% Fibonacci retracement level near 0.6530.
Heading into the RBNZ, however, the daily chart is worth taking into account:
NZD/USD daily chart

There are prospects of a deeper correction to test the prior resistance at a 38.2% Fibo of 0.6416. The move would also be filling in the wick of the prior day's trade, which is a typical occurrence in clearing up some unfinished business on the 4-hour chart by the bears.
NZD/USD H4 chart
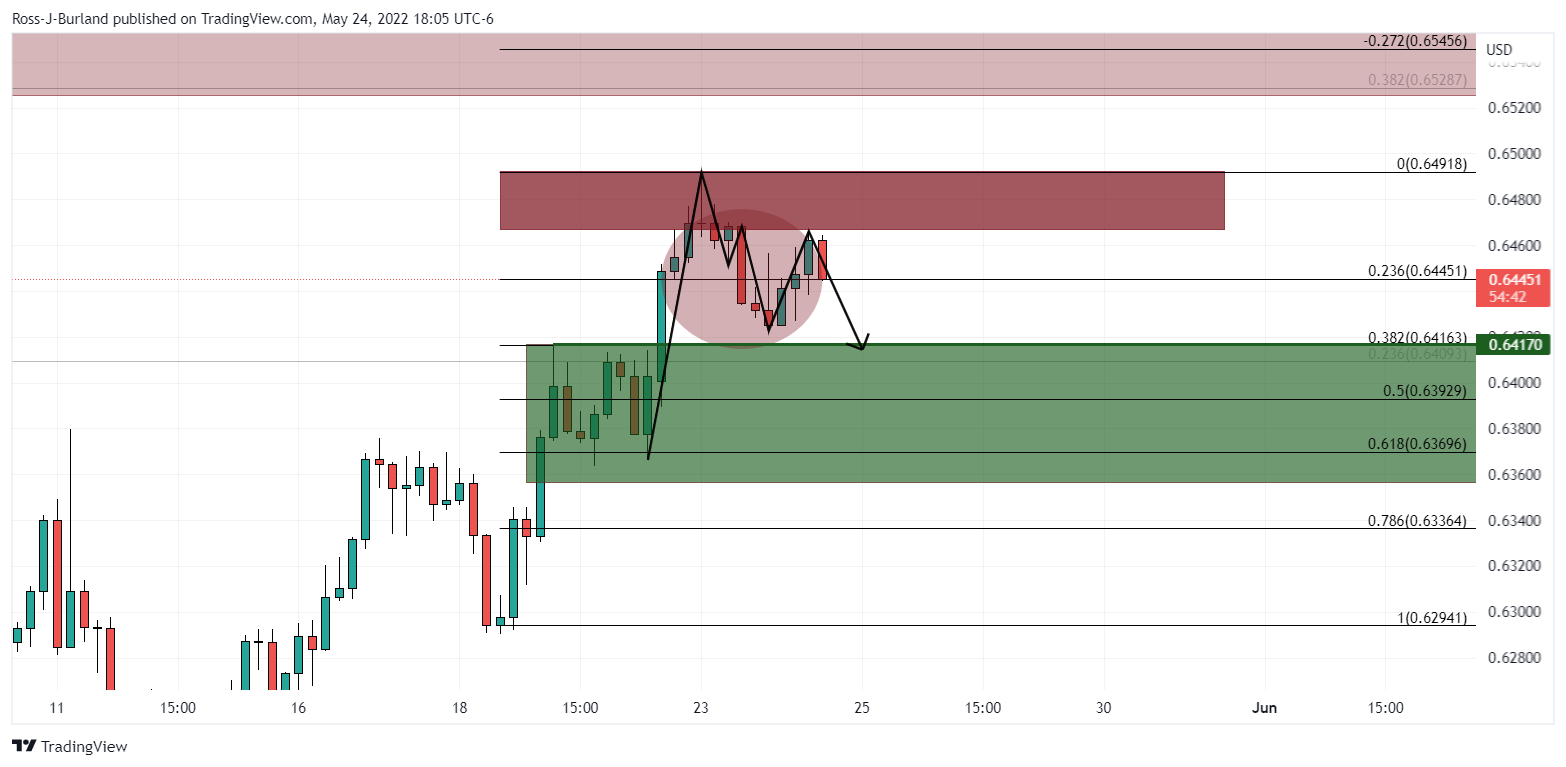
The M-formation's neckline has offered resistance and the bears are taking over with the old resistance eyed to the aforementioned 0.6416 area.